Using the Model via the Graphical User Interface
The graphical user interface (GUI) to the ALI-Tax-Analyzer model guides you through the specification of a model run (automatically generating a run specification file), executes the run, and provides easy viewing of all resulting text output and graphs in your default web browser.
Below you can read suggestions about getting started using the GUI and then look at one of the standard graphs that shows a tax reform's effect on the government's aggregate tax revenue and on the distribution of tax burdens across income groups in the population.
Getting Started
Start the GUI using the aligui tool at the Anaconda Prompt, and read
the Help page to understand the GUI workflow.
The GUI is organized as a notebook in which each page is accessed by clicking on its tab.
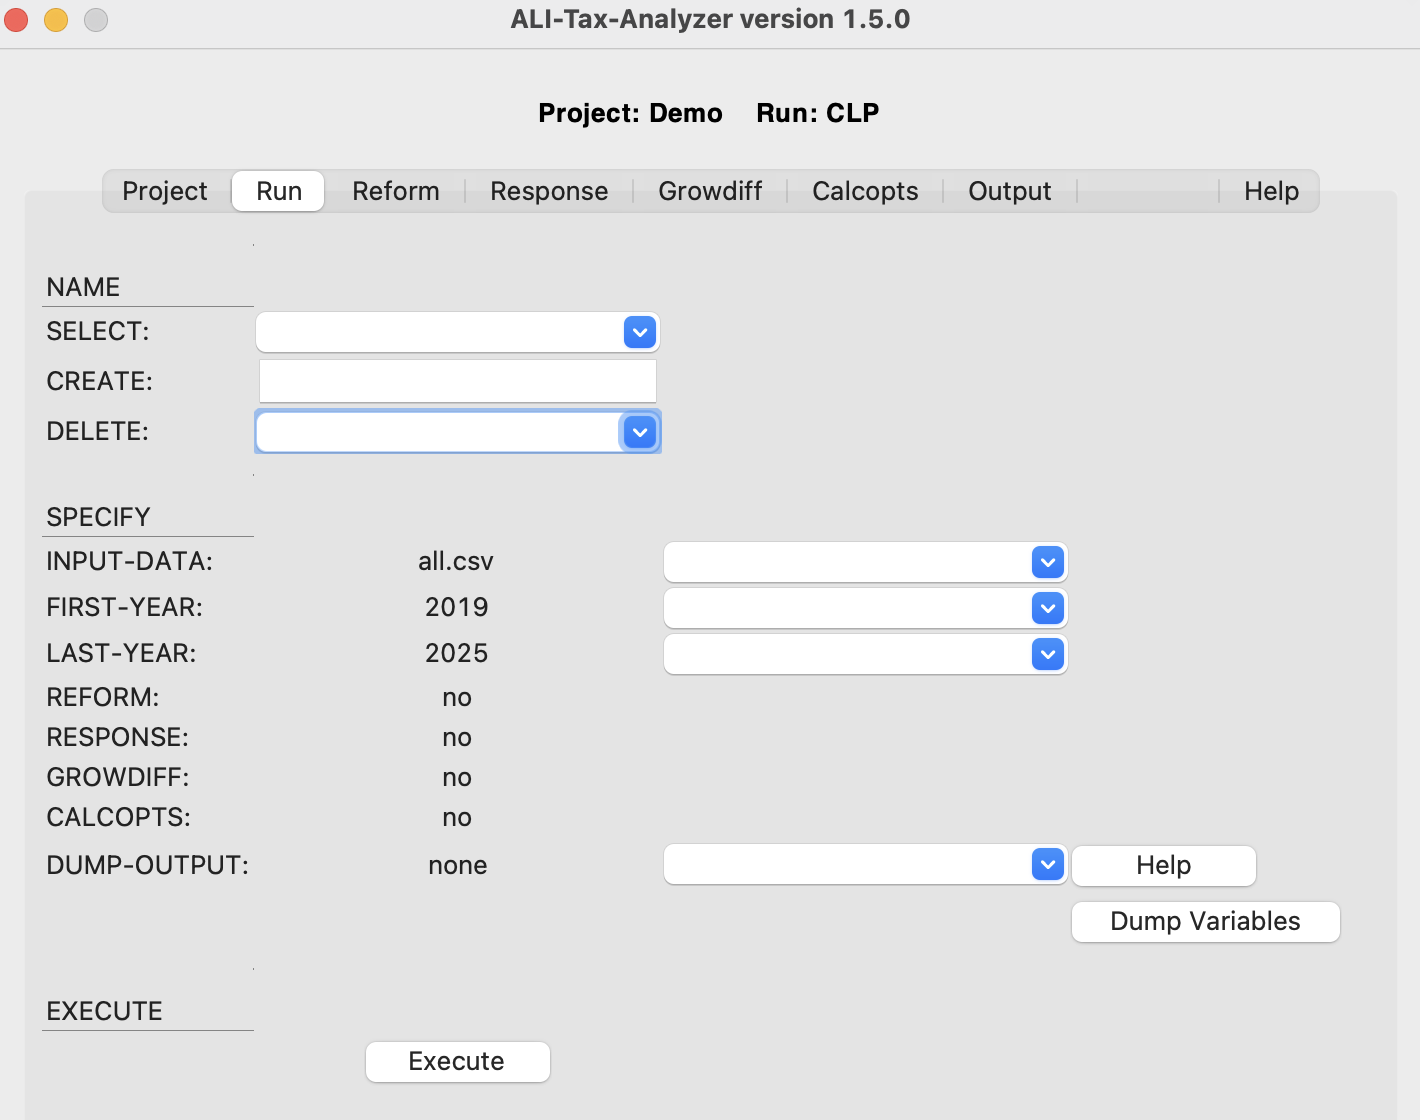
When on the Run notebook page on a Mac computer (running MacOS 11.6 Big Sur), the GUI for the ALI-Tax-Analyzer appears as shown below. On a Windows computer the GUI would have the look and feel of a native Windows application.
Visualizing Reform Effects
The model simulates both social security contribution (or payroll) taxes and personal income taxes in Albania. Each has a distinctive feature that makes it challenging to understand the distribution of tax burdens. The distinctive feature of the payroll tax is that individuals with positive earnings below 360,000 ALL per year have a payroll tax liability equal to a taxpayer with earnings of 360,000 ALL. This means, for example, that a taxpayer with very low earnings could have a payroll tax liability greater total income. The distinctive feature of the income tax is that, while earnings are taxed using a progressive rate schedule, income other than earnings is taxed at one of two flat rates.
Here we introduce the GUI's graphical output features by considering a reform that has two provisions. One reform provision eliminates the minimum payroll tax amount (by lowering the 360,000 to zero), which would make the Albania payroll tax operate like the payroll tax operates in most other countries. The other reform provision combines all non-employment income with earnings and taxes that combined income using the existing progressive tax schedule. This second reform provision would make the Albania income tax be a progressive tax on all income similar tax systems in a number of other countries.
The aggregate government revenue effect and the shift in effective (or average) tax rates induced by this reform are shown in the following graph, which is automatically generated by the GUI:
2022 Revenue Change and Effective Tax Rates by Income Percentile

Notice that we have removed from this graph all taxpayers below the 40th income percentile because their pre-reform tax rates rise to very high levels, which obscures the effect of the reform on taxpayers above the 40th income percentile.
The tax tables, which are also automatically generated by the GUI, show that the increase in aggregate tax revenue of almost 2.3 billion ALL is composed of a large decline in payroll tax revenue and a large rise in income tax revenue.
The effective tax rate graph shows the sharp decline in tax burden among low-income taxpayers (caused by the elimination of the minimum payroll tax) and the modest rise in tax burden among a small group of the highest-income taxpayers (caused by the progressive taxation of non-employment income).
Other graphs, all of which are automatically generated by the GUI, show this shift in tax burden by income percentile from different perspectives.
The range of tabular and graphical output automatically generated by the GUI provides a quick way to understand the effects of tax reforms.