Examples of Using the JSON CLI to USW-Tax-Analyzer
This document shows you how to use the JSON CLI to analyze any kind of parametric policy reform under static assumptions. It also illustrates non-static tax calculations using assumed household behavior responses caused by a reform.
It is recommended that you follow along with the examples below by
executing the runs on your computer as you read. Start following
along by reading the JSON CLI documentation and
and executing the uswta --test
command.
Below we use the $ character as the command prompt symbol, rather
the the > character typical on Windows.
The contents of this document are as follows:
- Comparing 2019 Results with BITSS OPA Results
- Analyzing Uniform Avoidance Elasticities
- Comparing Ten-Year Tax-Revenue Estimates
- Analyzing a More Complex Reform
- Analyzing the Sale of Assets to Pay Wealth Tax
Comparing 2019 Results with BITSS OPA Results
We begin using the JSON CLI to verify that the model produces results similar to the 2019 results in the Open Policy Analysis (OPA) of Elizabeth Warren's proposal published by the Berkeley Initiative for Transparency in the Social Sciences (BITSS). First, we compare results assuming no avoidance response to the reform. Then we show how to assume a uniform 16% avoidance rate and compare the results under this assumption with those from the BITSS OPA.
Both of these analyses use the same JSON reform file to specify the
provisions of Elizabeth Warren's proposal. It is named ew.json and
contains this text:
$ tacat ew.csv
{
    "comment00": "Elizabeth Warren's 2019 wealth tax proposal as described",
    "comment01": "in the BITSS Open Policy Analysis (OPA) at this URL:",
    "comment02": "https://github.com/BITSS/opa-wealthtax",

    "comment10": "This reform proposal calls for three wealth tax brackets,",
    "comment11": "where each brakN policy parameter specifies the TOP of",
    "comment12": "the taxable wealth bracket.",

    "comment21": "1st is a zero rate bracket for wealth up to $50 million:",
    "brak1": {"2019": 50e6}, "rate1": {"2019": 0.00},

    "comment22": "2nd is a 2% rate bracket from $50 million to $1 billion:",
    "brak2": {"2019":  1e9}, "rate2": {"2019": 0.02},

    "comment23": "3rd is a 3% rate bracket for wealth over $1 billion:",
    "brak3": {"2019": 9e99}, "rate3": {"2019": 0.03}
}
Comparing No-Avoidance Results
We produce results for the Warren reform assuming no avoidance
behavior in response to the reform by using the JSON CLI, which (as the
uswta --help command shows) requires three arguments: INPUT,
TAXYEAR, and REFORM.
$ uswta tax.csv 2019 ew.json
INPUT data are extrapolated to 2019 using default growth factors under CurLaw
INPUT data are extrapolated to 2019 using default growth factors under REFORM
Calculations for 2019 use no behavior response logic
Write minimal dump output file tax-19-ew.csv for 2019
Write table output file tax-19-ew.tab for 2019
Write REFORM parameter output file tax-19-ew.par for 2019
Write parameter changes output file tax-19-ew.pch for 2019
Run time is 0.2 seconds
Specifying tax.csv as the INPUT uses the model's tax.csv and
tax_weights.csv information as the input sample. Setting TAXYEAR
to 2019 and REFORM to ew.json instructs the JSON CLI to use 2019
policy parameters for the Warren reform proposal to calculate wealth
tax liability for each filing unit in the tax.csv sample.
When we use the GUI to the BITSS OPA model to specify this reform and assume no avoidance response, we get (on 2020-06-30) these numerical results:
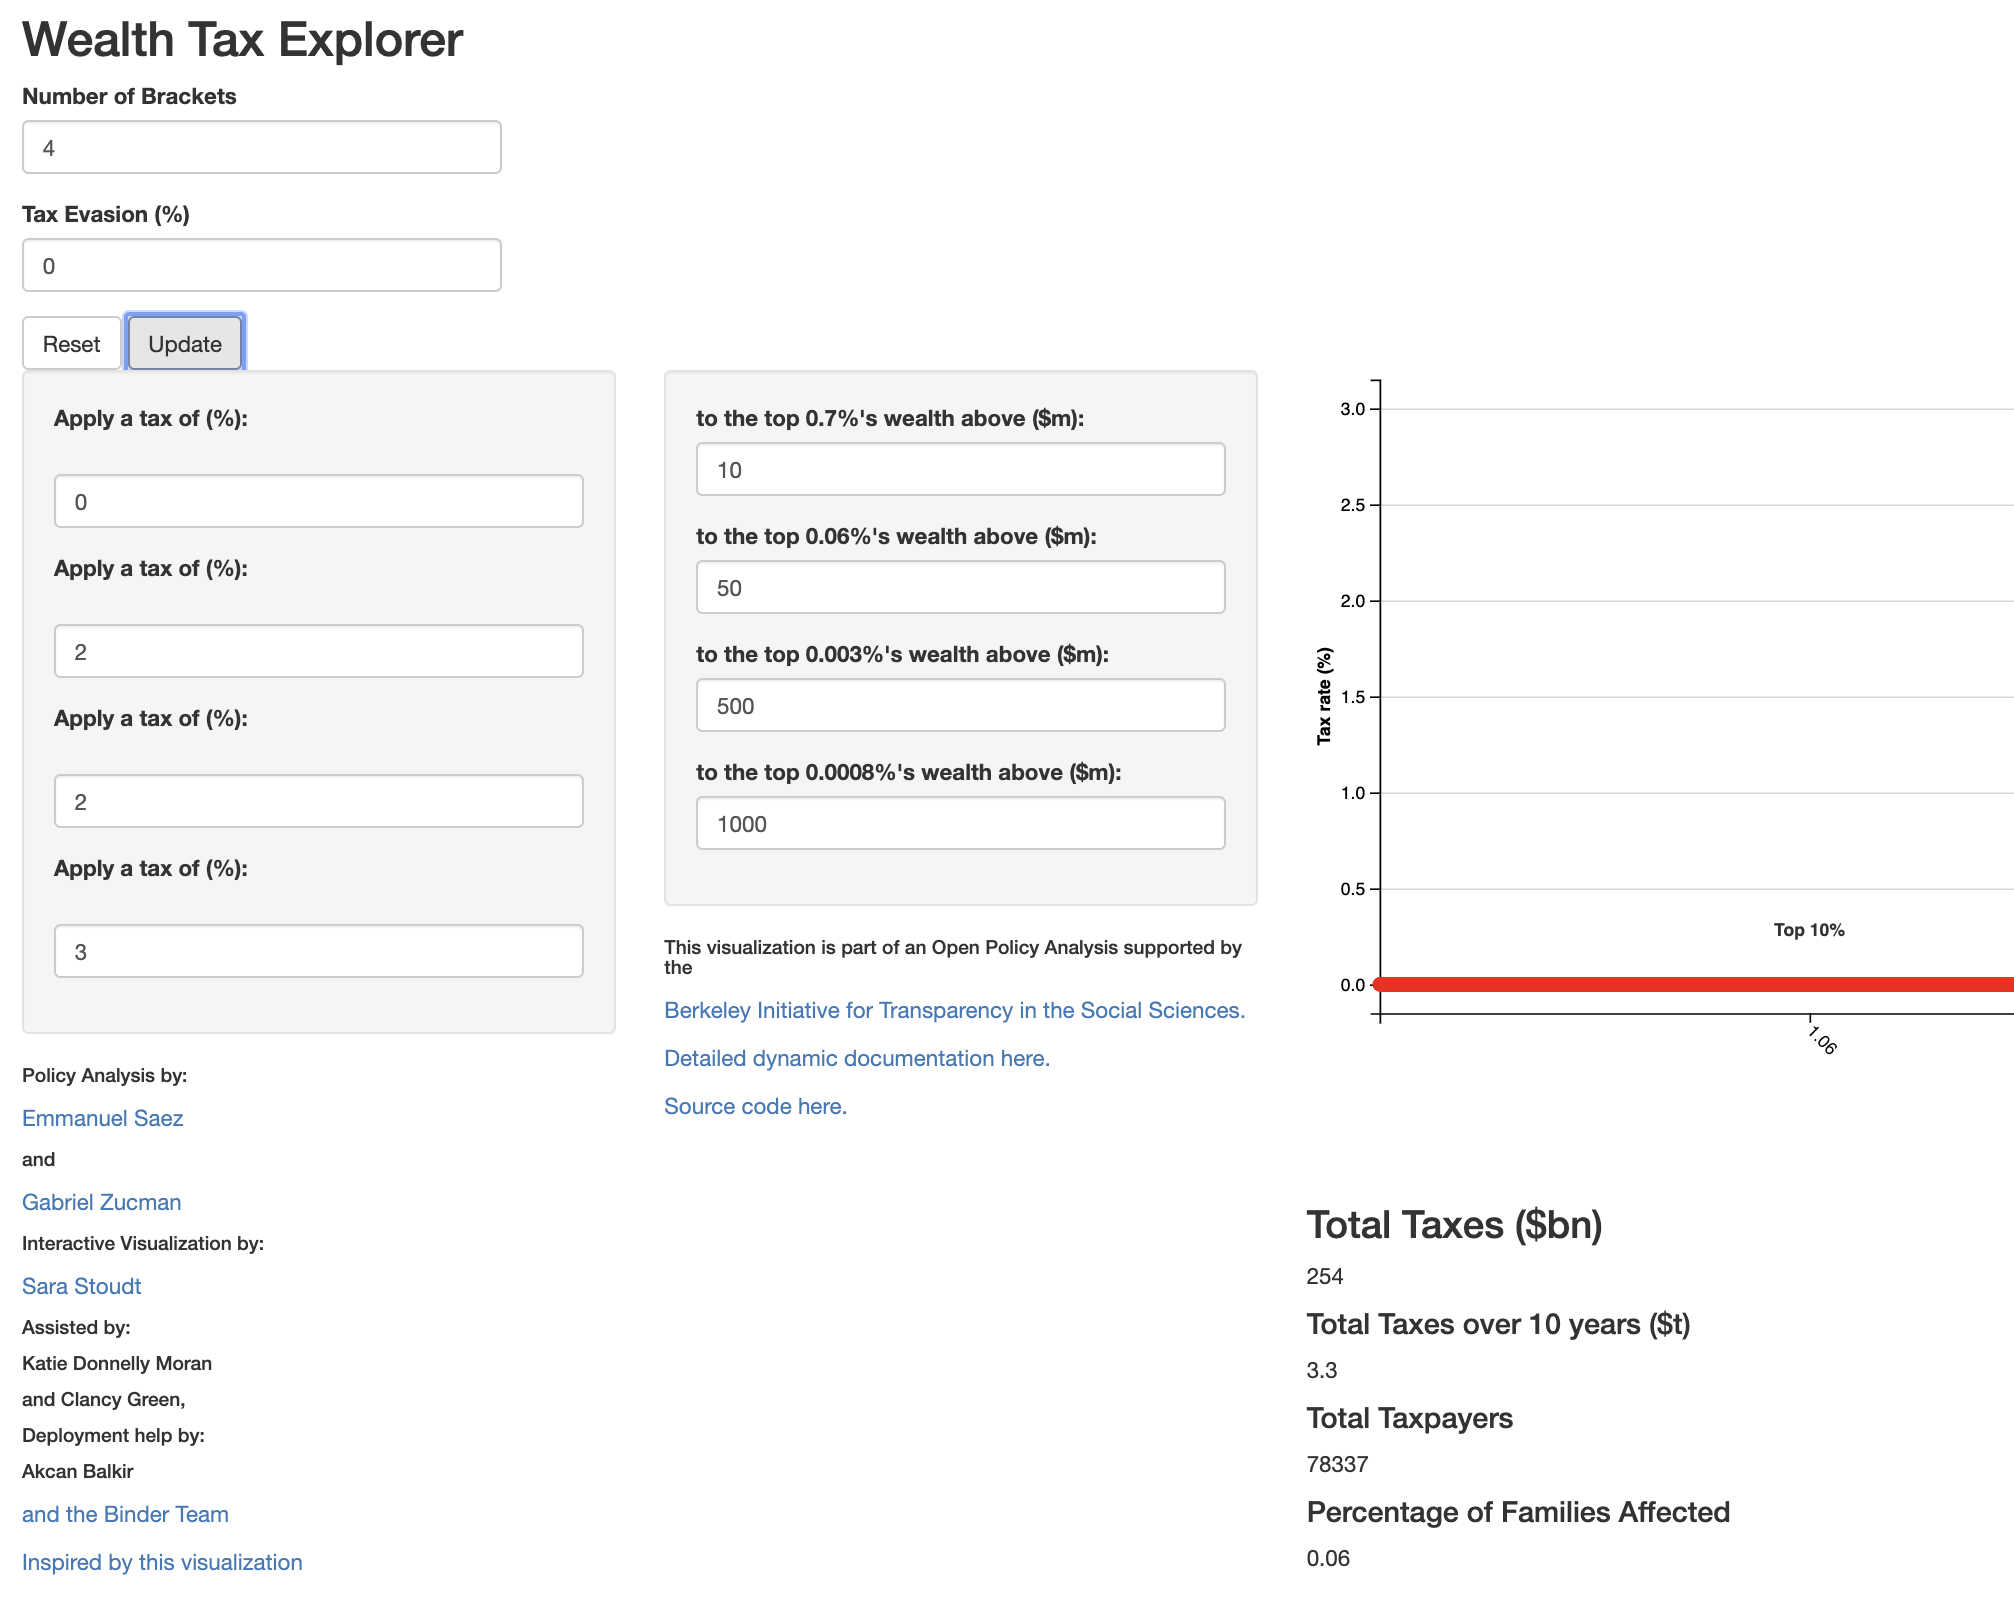
The BITSS OPA estimate of 2019 wealth tax liability is $254 billion with 78337 households (or 0.06%) having a positive tax liability.
We tabulate comparable statistics from the dump output using a simple AWK program (rather than using R or Python).
$ tacat opa.awk
# Tabulate BITSS-OPA-style statistics from USW-Tax-Analyzer CLI dump output.
# USAGE: awk -f opa.awk tax-19-REFORM...csv

BEGIN {
    FS = ","  # reading CSV file
}

NR == 1 {
    for (i = 1; i <= NF; i++) vcn[$i] = i  # remember variable column numbers
    next  # no further processing of the header row with variable names
}

{
    year = $vcn["year"]
    wght = $vcn["weight"]
    wealth = $vcn["wealth"]
    wtax = $vcn["wtax"]
}

{
    tot_wght += wght
    tot_wealth += wealth * wght
    tot_wtax += wtax * wght
}

wtax > 0 {
    tot_wght_with_tax += wght
}

END {
    printf "BITSS-OPA-style results for %d\n", year
    printf "total_wealth_tax_($b)= %.1f\n", tot_wtax * 1e-9
    printf "total_households_(#m)= %.3f\n", tot_wght * 1e-6
    printf "taxed_households_(#)= %.0f\n", tot_wght_with_tax
    printf "percent_hhs_taxed(%%)= %.2f\n", 100 * tot_wght_with_tax / tot_wght
}
Tabulating the dump output file with that AWK program produces these results:
$ awk -f opa.awk tax-19-ew.csv
BITSS-OPA-style results for 2019
total_wealth_tax_($b)= 254.7
total_households_(#m)= 156.436
taxed_households_(#)= 93895
percent_hhs_taxed(%)= 0.06
Notice that the estimates of tax revenue and number of taxed
households are both somewhat higher than the corresponding BITSS OPA
estimates. The tax revenue estimate rounds up to $255 billion, which
is slightly higher than the $254 billion OPA estimate. And even
though both models estimate the same percent of households being
taxed, the count of taxed households differs by 15558. These minor
differences are caused by the fact that the two models handle to same
data slightly differently. The BITSS OPA model treats each row in the
tax_grid.csv file as a histogram bin with a bottom and top threshold
as well as an average wealth. USW-Tax-Analyzer is a microsimulation
model that assumes each row represents one sample household with
wealth equal to the average on the row and weight equal to the number
of households on the row. So the two models differ only in their
treatment of the first data row (from tax_grid.csv) shown below:
gperc,nb,thres,sh,avg
...
99.940002,15558,49300000,.00875,52702816
99.949997,15739,55900000,.01005,59839040
...
The bin on the first data row, which contains 15558 households, has a bottom wealth threshold of $49.3 million, a top threshold of $55.9 million, and an average wealth of about $52.703 million. The logic in the BITSS OPA model treats the households on this row as owing no wealth tax (under the Warren reform) because the bottom threshold is below the reform's $50 million bracket boundary. Given that the average wealth on this row is over $50 million, this treatment understates the taxes owed by households on this row. The logic in the USW-Tax-Analyzer model treats all the households on this row as owing a tax. Given that some of the households on this row have wealth below $50 million, this treatment overstates the taxes owed by households on this row. Neither model's treatment of this data row is exactly correct (because models are approximations of reality) and the numerical differences resulting from these alternative treatments are tiny.
Comparing Uniform-Avoidance-Rate Results
Next we show how to specify responses to the Warren reform and compare results with those generated by the BITSS OPA model.
By default, USW-Tax-Analyzer generates static analysis of a reform, but
it has the option to specify non-zero elasticities in a response JSON
file. To make USW-Tax-Analyzer work like the BITSS OPA model assuming
a uniform 16% avoidance rate, we specify the ewavoid16p.json file as
follows:
$ tacat ewavoid16p.json
{
    "comment00": "Behavioral response to ew.json reform that mimics the",
    "comment01": "uniform 16% avoidance response assumed in the BITSS OPA",
    "comment02": "of Elizabeth Warren's 2019 wealth tax proposal at this URL:",
    "comment03": "https://github.com/BITSS/opa-wealthtax",

    "comment10": "The behavioral response logic built into USW-Tax-Analyzer",
    "comment11": "assume a log-log response function, in which the assumed",
    "comment12": "elasticity can vary across pre-reform levels of the",
    "comment13": "variable.  The substitution elasticity is multiplied by",
    "comment14": "the proportional change in the after-tax price of the",
    "comment15": "variable (that is, the proportional change in 1-MTR,",
    "comment16": "where MTR is the variable's marginal tax rate).",
    "comment17": "Since there is no wealth tax under current law, the",
    "comment18": "pre-reform after-tax price of wealth is 1.00.",
    "comment19": "In the 2% rate bracket, the post-reform after-tax price",
    "comment20": "of wealth is 0.98, which implies a proportional change",
    "comment21": "of -0.02.  Assuming an elasticity of 8.0 is required to",
    "comment22": "replicate the 16% avoidance rate assumed by BITSS-OPA.",
    "comment23": "Because the proportional change in the top 3% bracket",
    "comment24": "is -0.03, a lower elasticity of 5.3333333 is required to",
    "comment25": "replicate the uniform 16% avoidance rate assumed by BITSS.",

    "comment30": "The three-tax-bracket reform means that only four wealth",
    "comment31": "bin edges need to be specified with meaningful values,",
    "comment31": "and that only three elasticities values are meaningful.",

    "wealth_bin_edges": {"2019": [-9e99, 50e6, 1e9, 7e99, 8e99, 9e99]},
    "wealth_sub_elasticity": {"2019": [0.0, 8.0, 5.3333333, 0.0, 0.0]}
}
Then to use these elasticities in the analysis, we execute this command:
$ uswta tax.csv 2019 ew.json --response ewavoid16p.json
INPUT data are extrapolated to 2019 using default growth factors under CurLaw
INPUT data are extrapolated to 2019 using default growth factors under REFORM
Calculations for 2019 use behavior response logic
Write minimal dump output file tax-19-ew-ewavoid16p.csv for 2019
Write table output file tax-19-ew-ewavoid16p.tab for 2019
Write REFORM parameter output file tax-19-ew-ewavoid16p.par for 2019
Write parameter changes output file tax-19-ew-ewavoid16p.pch for 2019
Run time is 0.2 seconds
Tabulating the dump output yields these results:
$ awk -f opa.awk tax-19-ew-ewavoid16p.csv
BITSS-OPA-style results for 2019
total_wealth_tax_($b)= 198.9
total_households_(#m)= 156.436
taxed_households_(#)= 78337
percent_hhs_taxed(%)= 0.05
The corresponding results from the GUI to the BITSS OPA model are $199 billion tax liability and 0.05% of households owing a tax. In addition to these close agreements, we can see from the change table output that the reform is reducing wealth and from a comparison of the dump output that the 16% reduction in wealth is happening among households with pre-reform wealth above $50 million.
$ tatail -14 tax-19-ew-ewavoid16p.tab
2019 Weighted Reform Changes by CurLaw Wealth Decile
    Returns    Wealth      WTax
       (#m)      ($b)      ($b)
 0    15.64       0.0       0.0
 1    15.64       0.0       0.0
 2    15.64       0.0       0.0
 3    15.64       0.0       0.0
 4    15.64       0.0       0.0
 5    15.64       0.0       0.0
 6    15.64       0.0       0.0
 7    15.64       0.0       0.0
 8    15.64       0.0       0.0
 9    15.64   -2565.3     198.9
 A   156.44   -2565.3     198.9

$ csvjoin --csv tax-19-ew.csv tax-19-ew-ewavoid16p.csv \
          --var wealth --out ewavoid16p.csv --svar year weight

$ tahead -5 ewavoid16p.csv && tatail -5 ewavoid16p.csv
recid,wealth_1,wealth_2
1,-150176.00,-150176.00
2,-63890.00,-63890.00
3,-59553.00,-59553.00
4,-47942.00,-47942.00
138,6000000000.00,5040031439.11
139,6920000000.00,5812836259.77
140,9109999616.00,7652302612.94
141,18100000768.00,15204095486.42
142,66500001792.00,55862463933.48
The first of these commands shows the end of table output file, which contains pre-reform, post-reform, and reform-change distributional tables, in that order. The distributional results are not very useful because all the household affected by the reform are in the top wealth decile. The aggregate reduction in wealth in the top decile is substantially below 16% because most households in the top decile continue to face a zero marginal tax rate after the reform, and hence, have no avoidance response.
The second of these commands uses the csvjoin tool that comes
packaged with the model to merge the
no-avoidance and avoidance dump output files retaining just the wealth
variable in the joined output file.
The third of these commands simply shows the first five and last five
rows of that joined output file. Looking at the sample household with
recid equal to 138, we see the assumed 16% reduction in wealth from
$6.000 billion before the reform to $5.040 billion after the reform.
Analyzing Uniform Avoidance Elasticities
Some readers may be asking why should a uniform avoidance rate be assumed rather than a uniform avoidance elasticity. Those with wealth over $1 billion face a larger increase in the marginal tax rate on wealth than the those below $1 billion, and they may have more options for rearranging their financial affairs to reduce their wealth. What if we assume a uniform avoidance elasticity of 8.0?
The BITSS OPA discussion of the research literature on avoidance behavior makes it clear that there is much uncertainty about the appropriate assumption to make about avoidance behavior, so the analysis is this section should be viewed as a what-if exercise that illustrates the analytical flexibility of the USW-Tax-Analyzer.
We copy the ewavoid16p.json file to avoid8e.json, change the
5.3333333 on the last line to 8.0, and revise the comments to describe
the assumption of uniform avoidance elasticities. Then this command
produces the results we are interest in:
$ uswta tax.csv 2019 ew.json --response avoid8e.json
INPUT data are extrapolated to 2019 using default growth factors under CurLaw
INPUT data are extrapolated to 2019 using default growth factors under REFORM
Calculations for 2019 use behavior response logic
Write minimal REFORM dump output file tax-19-ew-avoid8e.csv for 2019
Write table output file tax-19-ew-avoid8e.tab for 2019
Write REFORM parameter output file tax-19-ew-avoid8e.par for 2019
Run time is 0.2 seconds

$ awk -f opa.awk tax-19-ew-avoid8e.csv
BITSS-OPA-style results for 2019
total_wealth_tax_($b)= 189.5
total_households_(#m)= 156.436
taxed_households_(#)= 78337
percent_hhs_taxed(%)= 0.05
Notice that the number of taxed households is unchanged because the avoidance behavior in the lower tax bracket is unchanged. But those with pre-reform wealth over $1 billion now reduce wealth by 24%, and so, the aggregate tax liability is down by about 4.7 percent from $198.9 to $189.5 billion. This result suggests that the Warren reform would generate considerable tax revenue even with substantial avoidance rates among the most wealthy.
Comparing Ten-Year Tax-Revenue Estimates
When using microsimulation methods, ten-year revenue estimates are generated by extrapolating monetary data variables and policy parameters to future years and computing a tax liability estimate for each of those years. Following the BITSS OPA assumptions, the USW-Tax-Analyzer PRICES growth factor has been set to 1.025 and the WEALTH growth factor to 1.055 in all years.
The BITSS OPA model does not use microsimulation methods, but rather scales up the 2019 estimate by a factor. Footnote 3 in the dynamic documentation of the BITSS OPA explains how the value of that factor is calculated:
With r=5.5%, we have [1+(1+r)+..+(1+r)^9]=[(1+r)^10-1]/r=12.9, or approximately 13.
But this approach is exactly accurate only for a linear tax. In that case, an X% growth in the tax base does generate an X% growth in the tax liability. For a non-linear tax rate schedule, this approach is only an approximation. For a progressive tax rate schedule, it is an underestimate because it ignores the movement over time of some filing units into higher tax brackets.
Given this observation, it should be expected that, when using the same assumptions for the Warren reform, the ten-year revenue estimate generated by microsimulation will be larger than that generated by BITSS OPA method. As explained in the rest of this section, that is exactly what the USW-Tax-Analyzer simulations show.
There is no mention in the BITSS OPA about the tax bracket thresholds
being indexed for inflation in the Warren reform, so that is what is
assumed here. A ten-year simulation is executed by simply adding the
--numyears 10
option to the JSON CLI command.
$ uswta tax.csv 2019 ew.json --response ewavoid16p.json --numyears 10 > res

$ tahead res
-----
INPUT data are extrapolated to 2019 using default growth factors under CurLaw
INPUT data are extrapolated to 2019 using default growth factors under REFORM
Calculations for 2019 use behavior response logic
Write minimal dump output file tax-19-ew-ewavoid16p.csv for 2019
Write table output file tax-19-ew-ewavoid16p.tab for 2019
Write REFORM parameter output file tax-19-ew-ewavoid16p.par for 2019
Write parameter changes output file tax-19-ew-ewavoid16p.pch for 2019
-----
INPUT data are extrapolated to 2020 using default growth factors under CurLaw

$ tatail res
Write minimal dump output file tax-28-ew-ewavoid16p.csv for 2028
Write table output file tax-28-ew-ewavoid16p.tab for 2028
Write REFORM parameter output file tax-28-ew-ewavoid16p.par for 2028
Write parameter changes output file tax-28-ew-ewavoid16p.pch for 2028
-----
AggregateTotal number years 10
AggregateTotal wtax curlaw 0.0
AggregateTotal wtax reform 2873.9
AggregateTotal wtax change 2873.9
-----
Run time is 0.8 seconds
So we see that USW-Tax-Analyzer writes output files for each of the ten years and also summarizes the ten-year revenue estimate as being about $2.8739 trillion. We can confirm the the 2019 results are the same as in a one-year run by tabulating the dump output for 2019.
$ awk -f opa.awk tax-19-ew-ewavoid16p.csv
BITSS-OPA-style results for 2019
total_wealth_tax_($b)= 198.9
total_households_(#m)= 156.436
taxed_households_(#)= 78337
percent_hhs_taxed(%)= 0.05
And we can see the movement of some households into higher tax brackets by tabulating the dump output for 2028, the tenth year of the simulation.
$ awk -f opa.awk tax-28-ew-ewavoid16p.csv
BITSS-OPA-style results for 2028
total_wealth_tax_($b)= 397.4
total_households_(#m)= 156.436
taxed_households_(#)= 156722
percent_hhs_taxed(%)= 0.10
Notice that, by assumption, the total number of households is unchanged, but the fraction that are taxed has doubled from 0.05% to 0.10%. This is still a tiny fraction of the population, but the rise illustrates the effects of bracket creep.
As expected, even though the 2019 estimates are in close agreement, the ten-year revenue estimates are noticeably different. The ratio of the ten-year to the one-year (2019) estimates generated by USW-Tax-Analyzer is 14.45 in comparison to the 12.9 factor used in the BITSS OPA. Of course, assuming that the tax bracket thresholds in the Warren reform are inflation indexed would reduce, but not eliminate, the effects of bracket creep.
Analyzing a More Complex Reform
Imagine a situation in which proponents of the Warren reform had almost enough support in Congress to pass the bill, but opponents of the reform demanded that the wealth tax brackets be indexed for inflation. The proponents countered with a modified reform that was the same as the Warren reform in the first year (2019), but then lowered the tax brackets in 2020 and again in 2021 before inflation indexing them, and then in 2025 the tax brackets would revert to their 2019 values indexed to 2025. What would be the ten-year revenue estimate for this alternative Warren reform and how would it compare to the ten-year revenue estimate for the original Warren reform?
We answer those questions assuming a constant avoidance elasticity of eight (as discussed above). Ten-year results for the original Warren reform are generated using this command:
$ uswta tax.csv 2019 ew.json --response avoid8e.json --numyears 10 > reso

$ tatail reso
Write table output file tax-28-ew-avoid8e.tab for 2028
Write REFORM parameter output file tax-28-ew-avoid8e.par for 2028
Write parameter changes output file tax-28-ew-avoid8e.pch for 2028
-----
AggregateTotal number years 10
AggregateTotal wtax curlaw 0.0
AggregateTotal wtax reform 2730.9
AggregateTotal wtax change 2730.9
-----
Run time is 0.8 seconds
We can confirm that the brackets are not indexed in the original Warren reform by using this command to look at the values of the tax brackets in each of the ten years:
$ tagrep -e brak1 -e brak2 tax-??-ew-avoid8e.par
tax-19-ew-avoid8e.par:pr brak1 50000000.0
tax-19-ew-avoid8e.par:pr brak2 1000000000.0
tax-20-ew-avoid8e.par:pr brak1 50000000.0
tax-20-ew-avoid8e.par:pr brak2 1000000000.0
tax-21-ew-avoid8e.par:pr brak1 50000000.0
tax-21-ew-avoid8e.par:pr brak2 1000000000.0
tax-22-ew-avoid8e.par:pr brak1 50000000.0
tax-22-ew-avoid8e.par:pr brak2 1000000000.0
tax-23-ew-avoid8e.par:pr brak1 50000000.0
tax-23-ew-avoid8e.par:pr brak2 1000000000.0
tax-24-ew-avoid8e.par:pr brak1 50000000.0
tax-24-ew-avoid8e.par:pr brak2 1000000000.0
tax-25-ew-avoid8e.par:pr brak1 50000000.0
tax-25-ew-avoid8e.par:pr brak2 1000000000.0
tax-26-ew-avoid8e.par:pr brak1 50000000.0
tax-26-ew-avoid8e.par:pr brak2 1000000000.0
tax-27-ew-avoid8e.par:pr brak1 50000000.0
tax-27-ew-avoid8e.par:pr brak2 1000000000.0
tax-28-ew-avoid8e.par:pr brak1 50000000.0
tax-28-ew-avoid8e.par:pr brak2 1000000000.0
So under this avoidance assumption, the original Warren reform, in which the tax brackets are not inflation indexed, is estimated to generate revenues of $2730.9 billion over the ten years beginning in 2019.
The alternative Warren reform is specified in the ewalt.json file,
which looks like this:
# tacat ewalt.json
{
    "comment00": "An alternative to Senator Warren's 2019 wealth tax proposal",
    "comment01": "that calls for a phased-in reform with inflation-indexed",
    "comment02": "tax brackets and a reversion in the reform's seventh year",
    "comment03": "to the first reform year's tax brackets indexed to the",
    "comment04": "reversion year.  See ew.json for the original Warren wealth",
    "comment05": "tax reform proposal.",

    "brak1": {"2019": 50e6, "2020": 45e6, "2021": 40e6},
    "brak1-indexed": {"2021": true},
    "brak1-revert_in_yr": {"2021": 2025},
    "brak1-revert_to_yr": {"2021": 2019},
    "rate1": {"2019": 0.00},

    "brak2": {"2019":  1000e6, "2020": 900e6, "2021": 800e6},
    "brak2-indexed": {"2021": true},
    "brak2-revert_in_yr": {"2021": 2025},
    "brak2-revert_to_yr": {"2021": 2019},
    "rate2": {"2019": 0.02},

    "brak3": {"2019": 9e99},
    "rate3": {"2019": 0.03}
}
Ten-year results for the alternate Warren reform are generated using this command:
$ uswta tax.csv 2019 ewalt.json --response avoid8e.json --numyears 10 > resa

$ tatail resa
Write table output file tax-28-ewalt-avoid8e.tab for 2028
Write REFORM parameter output file tax-28-ewalt-avoid8e.par for 2028
Write parameter changes output file tax-28-ewalt-avoid8e.pch for 2028
-----
AggregateTotal number years 10
AggregateTotal wtax curlaw 0.0
AggregateTotal wtax reform 2730.8
AggregateTotal wtax change 2730.8
-----
Run time is 0.8 seconds
So under this avoidance assumption, the alternative Warren reform is estimated to generate revenues of $2730.8 billion over the ten years beginning in 2019, which is almost identical to the $2730.9 billion estimate for the original Warren reform. But the effects of these two reforms are very different in the years beginning with the reversion year 2025. To see this, we first confirm that the tax brackets are changing as expected and then compare the effects of the two reforms in the tenth year 2028.
We can see the year by year values of the lower tax bracket, using this command:
$ tagrep -e brak1 tax-??-ewalt-avoid8e.par
tax-19-ewalt-avoid8e.par:policy brak1 50000000.0
tax-20-ewalt-avoid8e.par:policy brak1 45000000.0
tax-21-ewalt-avoid8e.par:policy brak1 40000000.0
tax-22-ewalt-avoid8e.par:policy brak1 41000000.0
tax-23-ewalt-avoid8e.par:policy brak1 42025000.0
tax-24-ewalt-avoid8e.par:policy brak1 43075624.99999999
tax-25-ewalt-avoid8e.par:policy brak1 57984670.91064451
tax-26-ewalt-avoid8e.par:policy brak1 59434287.683410615
tax-27-ewalt-avoid8e.par:policy brak1 60920144.87549587
tax-28-ewalt-avoid8e.par:policy brak1 62443148.49738327
The value of the lower tax bracket can be rounded to the nearest dollar by piping the grep output through a one-line AWK program (quoted as required on Linux and Mac computers) like this:
$ tagrep -e brak1 tax-??-ewalt-avoid8e.par \
      | awk '{printf "%s %s %.0f\n",$1,$2,$3}'
tax-19-ewalt-avoid8e.par:pr brak1 50000000
tax-20-ewalt-avoid8e.par:pr brak1 45000000
tax-21-ewalt-avoid8e.par:pr brak1 40000000
tax-22-ewalt-avoid8e.par:pr brak1 41000000
tax-23-ewalt-avoid8e.par:pr brak1 42025000
tax-24-ewalt-avoid8e.par:pr brak1 43075625
tax-25-ewalt-avoid8e.par:pr brak1 57984671
tax-26-ewalt-avoid8e.par:pr brak1 59434288
tax-27-ewalt-avoid8e.par:pr brak1 60920145
tax-28-ewalt-avoid8e.par:pr brak1 62443148
So, we see that the 2019 bracket of $50 million is lowered to $45
million in 2020 and then to $40 million in 2021, and is indexed for
inflation after that. Then in 2025 the bracket reverts back to its
indexed 2019 value: 50*(1.025)^6, which is about $57.985 million.
(You may think this is a contrived reform, but as of 2020 US income
tax law calls for this kind of policy reversion in 2026.)
And finally, we compare the results of the original and alternative Warren reforms in the tenth year of the reform.
$ awk -f opa.awk tax-28-ew-avoid8e.csv
BITSS-OPA-style results for 2028
total_wealth_tax_($b)= 377.3
total_households_(#m)= 156.436
taxed_households_(#)= 156722
percent_hhs_taxed(%)= 0.10

$ awk -f opa.awk tax-28-ewalt-avoid8e.csv
BITSS-OPA-style results for 2028
total_wealth_tax_($b)= 342.2
total_households_(#m)= 156.436
taxed_households_(#)= 109541
percent_hhs_taxed(%)= 0.07
Tenth-year revenue under the alternative reform (with indexed tax brackets) is about 9.3% less than under the original reform.
Analyzing the Sale of Assets to Pay Wealth Tax
Under the original Warren proposal, a household's annual wealth tax liability could easily exceed its annual income. In such a case, the household would presumably sell assets to raise the money needed to pay the tax. In our analysis so far, we have not considered this, which is an omission that overstates the future revenue generated by the proposed wealth tax. How can we estimate the ten-year revenue effects under the assumption that all wealth tax liabilities are paid from the proceeds of assets sales?
To answer this question, we use a capability built into the framework used to build the wealth tax model, which permits developers to specify simulation logic that is executed just once at the beginning of each year. Model developers can read about how to do this here, but model users only need to know how to invoke this logic using the CLI.
The USW-Tax-Analyzer has been built to include a boolean calculator
option named sell_assets_to_pay_tax. Its default value is false,
but we can change it to true in a JSON file just like we can change
the default values of other parameters. Here is the content of a JSON
file that activates the custom logic:
$ tahead sell.json
{ "sell_assets_to_pay_tax": {"2019": true} }
The sell-assets logic, which is executed once a year before any other tax calculations for that year are done, simply subtracts from each household's wealth the amount of the household's wealth tax liability for the prior year.
We can easily compare the ten-year revenue effects of the asset sales by executing two JSON CLI runs, the first with no asset sales and the second with asset sales.
$ uswta tax.csv 2019 ew.json --numyears 10 | tatail
Write minimal REFORM dump output file tax-28-ew.csv for 2028
Write table output file tax-28-ew.tab for 2028
Write REFORM parameter output file tax-28-ew.par for 2028
-----
AggregateTotal number years 10
AggregateTotal wtax curlaw 0.0
AggregateTotal wtax reform 3693.3
AggregateTotal wtax change 3693.3
-----
Run time is 0.8 seconds

$ uswta tax.csv 2019 ew.json --numyears 10 --calcopts sell.json | tatail
Write minimal REFORM dump output file tax-28-ew-#-#-sell.csv for 2028
Write table output file tax-28-ew-#-#-sell.tab for 2028
Write REFORM parameter output file tax-28-ew-#-#-sell.par for 2028
-----
AggregateTotal number years 10
AggregateTotal wtax curlaw 0.0
AggregateTotal wtax reform 3313.8
AggregateTotal wtax change 3313.8
-----
Run time is 0.8 seconds
The reduction is ten-year revenues is about $379.5 billion, which is a decline of slightly more than ten percent.
If your are following along by running these examples on your own
computer, you can tabulate the dump output files for 2028 generated by
these two runs (the tax-28-ew.csv and tax-28-ew-#-#-sell.csv
files, respectively) to see by how much wealth inequality has been
reduced by the wealth tax under the assumption that assets are sold to
pay the tax.
Note that other parameters can be added to the calcoptions.json
defaults file and used in new functions in the calcfunctions.py
module. An example would be a function, which is executed just once
at the start of each year, that simulates differential wealth growth
factors. Any such calculator options parameters can be changed from
their default values using the --calcopts JSON CLI option as
illustrated above.